Loading...

[Microbiology] Atlas of Antimicrobial Susceptibility Testing

Antimicrobial Susceptibility Testing, Atlas of Antimicrobial Susceptibility Testing, Atlas, of, Antimicrobial, Susceptibility, Testing, atlas in medical, tuyenlab.net

The tube on the left is a McFarland 0.5 turbidity standard.
Fig 1.  The tube on the left is a McFarland 0.5 turbidity standard. The tube on the right is a test bacterial suspension that has turbidity greater than that of the McFarland standard; it is more difficult to see the black lines through the test suspension than through the McFarland standard. Sterile saline or broth must be added to the test suspension to dilute it until the turbidity matches that of the McFarland standard.


Three benchtop nephelometric-type devices can be used to standardize the turbidity of a test inoculum suspension to match that of a McFarland 0.5 (or other) turbidity standard.
Fig 2.  Three benchtop nephelometric-type devices can be used to standardize the turbidity of a test inoculum suspension to match that of a McFarland 0.5 (or other) turbidity standard.

Broth-microdilution minimal inhibitory concentration (MIC) tray shown with inoculum reservoir trough.
Fig 3.  Broth-microdilution minimal inhibitory concentration (MIC) tray shown with inoculum reservoir trough. Diluted inoculum suspension is placed in the reservoir trough. Then the prongs are dipped into the suspension, raised, and subsequently lowered into the wells of the broth-microdilution MIC tray to inoculate all wells simultaneously.

Fig 4.  Tray-reading stand with magnifying mirror (left) and a light box (right). Following incubation, either of these devices is used to examine growth in the brothmicrodilution minimum inhibitory concentration (MIC) trays. A tray is placed on the tray-reading stand, and wells are examined by looking into the magnifying mirror. A tray is placed over the hole in the light box, and light is allowed to shine through the tray to facilitate close examination of the wells.

Steer’s replicator.
Fig 5.  Steer’s replicator. The inoculator prongs are positioned above a 36-well seed trough that contains 36 different standardized inoculum suspensions. The handle on top of the prong unit is pressed to lower the prongs into all suspensions simultaneously, and when the prongs are raised, each contains a standardized volume of inoculum. The agar plate containing a defined concentration of antimicrobial agent is positioned under the prongs (steel plate holding agar plate slides back and forth), and the prongs are carefully lowered to the agar, at which point the inocula are deposited on the agar surface. This process is repeated until all antimicrobial-containing and control agar plates (without antimicrobial agent) have been inoculated.

 Enterobacter aerogenes tested by the disk diffusion method.
Fig 6.  Enterobacter aerogenes tested by the disk diffusion method. Zone measurements confirm that the isolate is susceptible to all agents tested except ampicillin (at the 1-o’clock position) and cefazolin (at the 2-o’clock position). No zones are present for either of these agents

 Example of scattergram and regression analysis plot used to determine disk diffusion zone diameter interpretive breakpoints for hypothetical drug “X.”
Fig 7.  Example of scattergram and regression analysis plot used to determine disk diffusion zone diameter interpretive breakpoints for hypothetical drug “X.” Based on clinical response data, isolates with minimum inhibitory concentration (MIC) 8.0 µg/mL or less are considered susceptible. As derived from this scattergram, corresponding zones of 20 mm or more would be interpreted as susceptible. Isolates with MICs of 32.0 µg/mL or more and zones of 11 mm or less are resistant. The intermediate designation is used for isolates whose values fall between the susceptible and the resistant MICs (16 µg/mL) and zone interpretive breakpoints (12 to 19 mm).

Cartridges containing antimicrobial susceptibility test disks are inserted into the dispenser
Fig 8.  Cartridges containing antimicrobial susceptibility test disks are inserted into the dispenser (left). The dispenser (which can hold up to 12 different cartridges of disks) is positioned over an inoculated plate, and light pressure is applied to the handle to simultaneously deposit one of each type of disk onto the plate. The tight-sealing container in the background contains a desiccant packet and is used for storage (at 2° to 8° C) of the dispenser containing a working supply of disks.

Escherichia coli tested by the disk diffusion method
Fig 9.  Escherichia coli tested by the disk diffusion method. The lawn of growth following overnight incubation shows individual colonies, representing unsatisfactory growth. The most likely explanation for the scanty growth is the use of an inoculum that either is too light or contains too many nonviable cells, resulting in larger than normal zones and potentially false susceptible results.

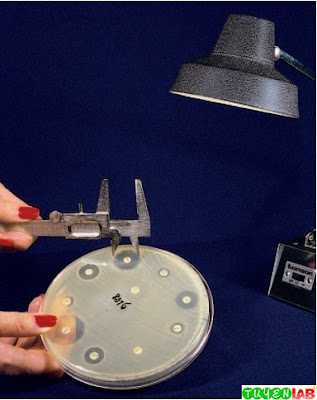
Fig 10.  Routine disk diffusion tests are examined by placing the plate on or 2 to 3 inches above a black, nonreflecting surface. Reflected light is used to illuminate the plate.

 Disk diffusion tests for staphylococci with oxacillin (or methicillin or nafcillin) and vancomycin and for enterococci with vancomycin are examined by holding the plate up to a light source (transmitted light) for zone examination.
Fig 11.  Disk diffusion tests for staphylococci with oxacillin (or methicillin or nafcillin) and vancomycin and for enterococci with vancomycin are examined by holding the plate up to a light source (transmitted light) for zone examination. Any growth within the zone is significant.

An oxacillin (1-µg) disk is used to screen for penicillin susceptibility in Streptococcus pneumoniae isolated from specimens other then sputum.
Fig 12.  An oxacillin (1-µg) disk is used to screen for penicillin susceptibility in Streptococcus pneumoniae isolated from specimens other then sputum. If the oxacillin zone of inhibition is 20 mm or more, the isolate is reported as penicillin susceptible. If the oxacillin zone is 19 mm or less, a penicillin minimal inhibitory concentration (MIC) test must be performed. The isolate pictured has an oxacillin zone of approximately 15 mm, so a penicillin MIC test must be performed.

The oxacillin zone for heteroresistant oxacillin-resistant Staphylococcus aureus often shows a haze of growth within the zone of inhibition.
Fig 13.  The oxacillin zone for heteroresistant oxacillin-resistant Staphylococcus aureus often shows a haze of growth within the zone of inhibition. This haze is significant, and the isolate here is oxacillin resistant.

Fig 14.  D-zone testing of Staphylococcus aureus that has erm-mediated inducible clindamycin resistance. The positive reaction is noted by a flattening of the zone around the clindamycin disk in the area where there has been diffusion of both erythromycin and clindamycin molecules.

Extended spectrum β-lactamase (ESBL) phenotypic confirmatory testing of Klebsiella pneumoniae.
Fig 15.  Extended spectrum β-lactamase (ESBL) phenotypic confirmatory testing of Klebsiella pneumoniae. The standard disk diffusion test is performed with both cefotaxime and ceftazidime with and without clavulanic acid. The diameter of the zone around cefotaxime-clavulanic acid (4-o’clock position) is greater than 5 mm larger than the zone around cefotaxime (5-o’clock position), which indicates a positive reaction as clavulanic acid restores the activity of cefotaxime. Although the zones for ceftazidime and ceftazidime-clavulanic acid are comparable, only one “set” of drugs needs to be positive to confirm an isolate as an ESBL producer.

BD Phoenix Automated Microbiology System.
Fig 16.  BD Phoenix Automated Microbiology System.

Fig 17.  BD Phoenix test cartridges, which contain 136 wells of antimicrobial agents or biochemical tests.

MicroScan WalkAway SI.
Fig 18.  MicroScan WalkAway SI.

Fig 19.  MicroScan Renok inoculator device, which is used to reconstitute and inoculate dried antimicrobial agents or biochemical tests in the test panels. A test panel is also shown.

TREK Sensititre ARIS 2X.
Fig 20.  TREK Sensititre ARIS 2X.

Vitek test card containing dried antimicrobials connected by a transfer straw to a tube containing a standardized inoculum suspension of bacteria to be tested.
Fig 21.  Vitek test card containing dried antimicrobials connected by a transfer straw to a tube
containing a standardized inoculum suspension of bacteria to be tested. These are placed into an evacuating chamber, which allows the inoculum to be transferred into the card. All wells containing varying concentrations of various antimicrobial agents are reconstituted during this inoculation process. Finally, the inoculated cards are placed into the Vitek instrument for processing.

VITEK 2 System.
Fig 22.  VITEK 2 System.

Fig 23.  Escherichia coli tested with an Etest gentamicin strip. The gentamicin minimal inhibitory
concentration

β-Lactamase hydrolyzes the β-lactam ring portion of the penicillin molecule
Fig 24. β-Lactamase hydrolyzes the β-lactam ring portion of the penicillin molecule. The hydrolysis results in the formation of penicilloic acid, which does not have antibacterial activity.

Cefinase β-lactamase disk test. Cells from several colonies of Haemophilus influenzae were applied to a moistened disk. This photo shows results following testing of two different isolates. Within 10 minutes, the disk on the left turned brown-red (positive), and that on the right maintained a light yellow color (negative).
Fig 25.  Cefinase β-lactamase disk test. Cells from several colonies of Haemophilus influenzae were applied to a moistened disk. This photo shows results following testing of two different isolates. Within 10 minutes, the disk on the left turned brown-red (positive), and that on the right
maintained a light yellow color (negative).

Staphylococcus aureus grown on a blood agar plate to which an oxacillin disk has been applied
Fig 26.  Staphylococcus aureus grown on a blood agar plate to which an oxacillin disk has been applied. Cells around the periphery of the zone have been exposed to oxacillin molecules as they diffused into the agar, and these cells are used for the β-lactamase test. Oxacillin is a good inducer of staphylococcal β-lactamase and will induce the strain to produce larger quantities of β-lactamase.
Consequently, strains that are penicillin susceptible (minimal inhibitory concentration 0.06 to 0.12 µg/mL) are tested for Î²-lactamase production following exposure to an inducing agent to determine whether they are β-lactamase positive and thus penicillin resistant.

Broth-macrodilution test showing vancomycin and Staphylococcus aureus
Fig 27.  Broth-macrodilution test showing vancomycin and Staphylococcus aureus. The minimal
inhibitory concentration (MIC) is 1.0 µg/mL. The purity plate shows a pure culture. The colony count plate shows 53 colonies, which means that 5.3 × 10⁵ colony-forming units (CFU)/mL of bacteria were in the test tubes immediately after inoculation of the MIC test. For the colony count plate, immediately after inoculation the growth control tube was diluted 1:1000, and 0.1 mL was plated. Now 0.01 mL will be plated from each clear tube (tubes containing 1.0 through 128 µg/mL of vancomycin) for the minimum bactericidal concentration determination. Because it was shown that the actual colony count in the MIC test was 5.3 × 10⁵ CFU/mL, growth of five or fewer colonies would indicate a 3 log10 decrease or 99.9% killing. By definition the concentration of drug in the respective tube would be considered bactericidal.


Fig 28. Subculture plates from the minimal inhibitory concentration test of vancomycin and
Staphylococcus aureus shown in Figure 13-27. Subcultures from tubes containing 8.0 to 128 µg/mL of vancomycin show no growth. Subcultures from the tubes containing 2.0 µg/mL and 4.0 µg/mL show one and two colonies, respectively, indicating a greater than 99.9% killing. More than five colonies have grown from the 1.0 µg/mL tube, so the minimum bactericidal concentration is 2.0 µg/mL.

Assessment of antimicrobial combinations with the checkerboard method.
Fig 29. Assessment of antimicrobial combinations with the checkerboard
method. Panels A, B, and C depict the results of testing combinations of two drugs
(diluted in geometric twofold increments along the x and y axes; drug A along the x axis
and drug B along the y axis). Shading indicates visible growth, and concentrations are
expressed as multiples of the minimum inhibitory concentration. A, Indifference;
B, synergism; C, antagonism.

Effects of antimicrobial combinations as measured with the killing-curve method
Fig 30.  Effects of antimicrobial combinations as measured with the killing-curve method. A + B = synergism; C + D = antagonism; E + F = indifference.


This is a part of the book : Textbook of Diagnostic Microbiology 4th edition 2011 of authors: Connie R. Mahon, Donald C. Lehman and George Manuselis. If you want to view the full content of the book and support author. Please buy it here: http://amzn.to/2ctxo02


COMMENTS

Loading...
QC5
Loading...
Name

CLINICAL ATLAS,118,DERMATOLOGY ATLAS,11,EMERGENCY ATLAS,44,HAEMATOLOGY ATLAS,23,HUMAN ANATOMY,1,MICROBIOLOGY ATLAS,66,PARASITOLOGY ATLAS,4,PATHOLOGY ATLAS,22,PEDIATRIC ATLAS,41,STDs,19,SUBCLINICAL ATLAS,116,
ltr
item
Free Medical Atlas: [Microbiology] Atlas of Antimicrobial Susceptibility Testing
[Microbiology] Atlas of Antimicrobial Susceptibility Testing
Antimicrobial Susceptibility Testing, Atlas of Antimicrobial Susceptibility Testing, Atlas, of, Antimicrobial, Susceptibility, Testing, atlas in medical, tuyenlab.net
https://blogger.googleusercontent.com/img/b/R29vZ2xl/AVvXsEi5vaUHu39Eiz2kzs8tR6agqsyeG5v3nHehHpYQJKfH4qweZteRfSGNMfmX6pvs1vR2LueoVa0a1ZXdg2WojxyTDn23540tMw_h-TAblNS4ugw6H5jYcEGJeshiaQ4bP6MQu1c6GmTBLjOY/s400/vs13.1.jpg
https://blogger.googleusercontent.com/img/b/R29vZ2xl/AVvXsEi5vaUHu39Eiz2kzs8tR6agqsyeG5v3nHehHpYQJKfH4qweZteRfSGNMfmX6pvs1vR2LueoVa0a1ZXdg2WojxyTDn23540tMw_h-TAblNS4ugw6H5jYcEGJeshiaQ4bP6MQu1c6GmTBLjOY/s72-c/vs13.1.jpg
Free Medical Atlas
https://tuyenlab.blogspot.com/2016/08/microbiology-atlas-of-antimicrobial.html
https://tuyenlab.blogspot.com/
https://tuyenlab.blogspot.com/2016/08/microbiology-atlas-of-antimicrobial.html
true
3150612095398522649
UTF-8
Loaded All Posts Not found any posts VIEW ALL Readmore Reply Cancel reply Delete By Home PAGES POSTS View All RECOMMENDED FOR YOU LABEL ARCHIVE SEARCH ALL POSTS Not found any post match with your request Back Home Sunday Monday Tuesday Wednesday Thursday Friday Saturday Sun Mon Tue Wed Thu Fri Sat January February March April May June July August September October November December Jan Feb Mar Apr May Jun Jul Aug Sep Oct Nov Dec just now 1 minute ago $$1$$ minutes ago 1 hour ago $$1$$ hours ago Yesterday $$1$$ days ago $$1$$ weeks ago more than 5 weeks ago Followers Follow THIS PREMIUM CONTENT IS LOCKED STEP 1: Share. STEP 2: Click the link you shared to unlock Copy All Code Select All Code All codes were copied to your clipboard Can not copy the codes / texts, please press [CTRL]+[C] (or CMD+C with Mac) to copy